The Relative Strength Index is one of the most widely used technical indicators in existence, and for good reason. Developed by J. Welles Wilder Jr. and introduced in his 1978 book New Concepts in Technical Trading Systems, RSI gives traders a momentum-based read on whether a stock is running too hot or cooling off too fast. Wilder originally designed it using a 14-period setting, which remains the default on virtually every charting platform today.
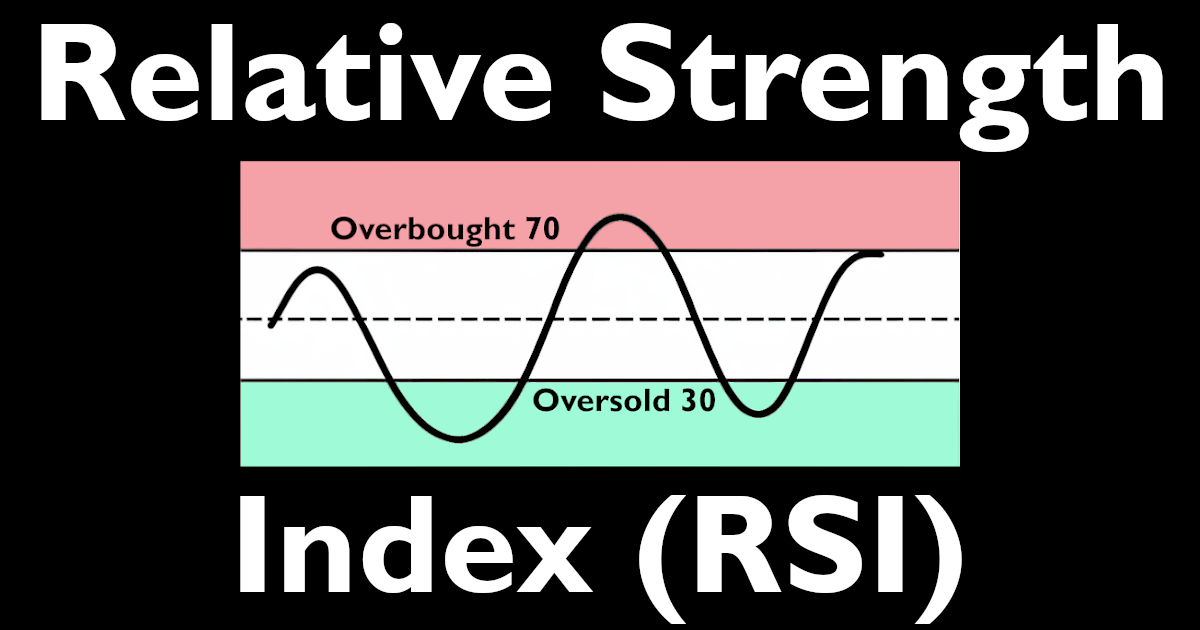
At its most basic level, RSI measures the speed and magnitude of recent price changes. It plots as a single line that oscillates between 0 and 100. Readings above 70 traditionally signal that a security may be overbought. Readings below 30 suggest it may be oversold. Simple enough. But traders who stop there are leaving a lot on the table.
What Is RSI and How Does It Actually Calculate Momentum?
The math behind RSI is straightforward once you break it down. The indicator compares the average gains to the average losses over a defined lookback period (default: 14 days). The formula is:
RSI = 100 - [100 / (1 + RS)]
* RS (Relative Strength) equals the average gain divided by the average loss over the period.
When a stock closes up more often and by larger amounts than it closes down, RS rises and RSI pushes toward 100. The reverse is also true. This is why RSI captures momentum so cleanly — it's literally tracking who is winning the daily tug-of-war between buyers and sellers.

Here's why this matters beyond the formula: institutions don't just buy and hold indefinitely. Portfolio managers, hedge funds, and algorithmic systems rebalance, take profits, and rotate capital on schedules and triggers. RSI helps retail traders see the footprints of those moves. When RSI reaches extreme levels, it often signals that a large wave of institutional buying or selling may be exhausting itself.
How To Identify Overbought and Oversold Conditions Using RSI
 The classic 70/30 thresholds are a starting point, not a complete strategy. A stock can grind through overbought territory for weeks during a powerful uptrend. Selling every time RSI crosses 70 in a bull run is a reliable way to exit winners too early.
A smarter application involves context. In a strong uptrend, RSI tends to oscillate between roughly 40 and 80. In a downtrend, it tends to stay pinned between 20 and 60. Veteran traders adjust their interpretation accordingly:
- In an uptrend: Watch for RSI to pull back toward 40-50 as a potential buy zone rather than waiting for the full drop to 30.
- In a downtrend: Consider the 55-65 zone as potential resistance on bounces rather than waiting for RSI to hit 70.
- In a sideways market: The traditional 30 and 70 levels work much more reliably when price is range-bound.
This adjustment reflects a core truth about momentum: trending markets sustain extreme readings far longer than most traders expect. The market can stay "wrong" for longer than an undisciplined trader can stay solvent.
3 Ways To Spot RSI Divergence and What It Signals
Divergence is arguably the most powerful RSI signal available. It occurs when price and RSI stop agreeing with each other, which often precedes a meaningful reversal.
1. Bearish Regular Divergence
Price makes a higher high, but RSI makes a lower high. This tells you the rally is losing internal momentum even as price ticks up. Institutional accumulation is waning. This is a warning that the move may be running on fumes.

2. Bullish Regular Divergence
Price makes a lower low, but RSI makes a higher low. Selling pressure is physically decreasing even as price presses lower. This is often where smart money starts quietly accumulating before the crowd catches on.
3. Hidden Divergence for Trend Continuation
Less talked about but equally useful. Bullish hidden divergence occurs when price makes a higher low but RSI makes a lower low. This is a continuation signal during an uptrend. Bearish hidden divergence is the mirror image, price makes a lower high and RSI makes a higher high. These signals are particularly effective for traders looking to add to an existing position rather than counter-trade a trend.

According to research published in the Journal of Financial Economics, momentum-based signals have demonstrated persistent predictive power across decades of equity market data, lending academic weight to what practitioners have observed empirically for years.
How To Use RSI Centerline Crossovers to Confirm Trend Direction
The 50 level on RSI acts as a momentum dividing line. When RSI crosses above 50, buyers have taken control of momentum. When it drops below 50, sellers dominate. This is a subtle but powerful filter.
Traders who only take long trades when RSI is above 50 and only take short trades when it's below 50 dramatically reduce the number of counter-trend trades that bleed accounts slowly over time. It sounds overly simple, but filtering trade direction by the RSI centerline has a real mechanical basis: it's screening for stocks where the average recent gain already exceeds the average recent loss (or vice versa for shorts).
What Is the Best RSI Setting for Daily Chart Trading?
Wilder's default of 14 periods remains the most common and battle-tested setting. A shorter period like 9 makes RSI more sensitive and generates more signals, with more false positives included. A longer period like 21 smooths the line and filters noise but may lag meaningful turns.
For daily chart trading, most professional technicians stick close to the 14-period default. The CMT Association's curriculum specifically highlights the 14-period RSI as the foundational setting for momentum analysis. Adjusting it is fine, but do so with a reason tied to your specific holding period and strategy, not just a preference for busier charts.
ASSIGNMENT: Practice Andrew Cardwell's RSI Range Strategy on the Trading Blitz Simulator
Andrew Cardwell is widely considered the foremost authority on RSI analysis. A student of Wilder himself, Cardwell developed the concept of RSI range rules. This is the idea that RSI operates in predictable zones depending on trend direction, and that those zones shift when the trend changes.

Here are the core rules of his approach adapted for daily chart practice:
- Rest Game History: Before you begin, reset your Game History in your Dashboard to ensure you aren't including any old data in your results.
- Identify the trend. Load a chart on the simulator and spend time reviewing the trend. Is price making higher highs and higher lows? Or lower highs and lower lows? Mark your assessment before adding RSI.
- Add RSI (14) to the chart. Note where RSI has been consistently finding support and resistance. In an uptrend, Cardwell observed RSI tends to hold above 40 and hit resistance around 80. In a downtrend, it tends to top out around 60 and fall through 20.
- Enter long trades when RSI pulls back into the 40-50 zone during an uptrend. Make a purchase when RSI touches this zone, and place a stop loss below the most recent swing low.
- Enter short trades when RSI rallies into the 55-65 zone during a downtrend. Use the same logic in reverse when going short. Enter a short position and use a stop above the recent swing high.
- Look for positive and negative reversals. Cardwell identified these as RSI making a lower low but then reversing to a higher high (positive reversal, bullish), and the inverse for negative reversals. These are continuation signals.
- Advance the chart day by day using Next Day. When your stop is hit or your target is reached, exit your position and log the trade result in the Notes section on the simulator. Specify whether the RSI zone held as expected.
- After ten to twenty trades, review your Notes. Were the RSI zones consistent with the trend you identified? Did the entries in the 40-50 pullback zone outperform the trades you took at extremes?
The goal of this exercise isn't to win every trade. It's to build the habit of reading RSI in the context of the overall trend rather than treating 70 and 30 as mechanical buy/sell triggers. Cardwell's framework rewards traders who think in terms of momentum regimes.
Load up Trading Blitz, drop RSI on the chart, and start clicking. Seeing your entry play out bar by bar is the fastest way to internalize what RSI is actually telling you before you put real capital behind it. Subscribe to Premium membership and you can filter charts by market cap, volume, patterns, and indicator actions (e.g. RSI crossed above 50 to see which stocks might be starting to trend)
Free Cash-Prize Touraments
We run free cash-prize tournaments (no entry fee required) when we go live on YouTube. Be sure to subscribe to our channel - @TradingBlitzSimulator - to get alerted when we go live next.
Disclaimer: Trading involves substantial risk of loss and is not appropriate for all investors. The information provided on Trading Blitz is for educational and informational purposes only. Nothing on this platform, including this article, constitutes financial advice, investment advice, or a recommendation to buy or sell any security. Simulated trading results do not guarantee or predict future performance in live markets. Past performance, whether real or simulated, is not indicative of future results. Always consult a qualified financial professional before making any investment decisions. For additional information, please see our Terms of Service.
Affiliate Disclosure: Some links in this article may be affiliate links. If you click through and make a purchase, Trading Blitz may earn a small commission at no additional cost to you. We only reference tools and resources we believe are relevant to traders.